GTA 5 Performance Monitoring Guide 2026
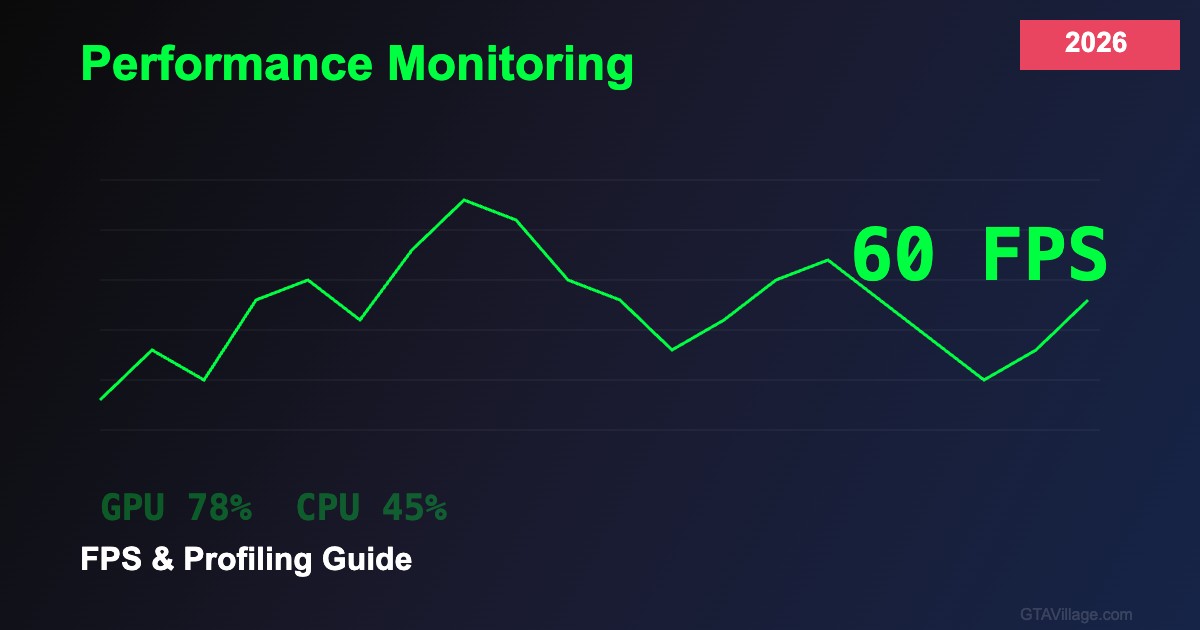
Running a heavily modded GTA 5 demands careful performance monitoring to maintain smooth gameplay. This 2026 guide covers essential FPS monitoring tools, GPU and CPU profiling techniques, and optimization strategies to squeeze maximum performance from your modded installation.
Essential Monitoring Tools
Start with built-in and free monitoring solutions: MSI Afterburner with RivaTuner Statistics Server provides real-time FPS overlay, GPU temperature, VRAM usage, and CPU per-core utilization. NVIDIA GeForce Experience and AMD Radeon Software offer native performance overlays. For deeper analysis, use GPU-Z for detailed graphics card metrics and HWiNFO64 for comprehensive system monitoring including thermal throttling detection.
Identifying Performance Bottlenecks
Understanding whether your system is CPU-bound or GPU-bound is critical for optimization. Monitor GPU usage — if it stays below 95% while FPS drops, your CPU is the bottleneck. Common CPU bottlenecks in modded GTA 5 include excessive script mods running simultaneously, complex AI routines from population mods, and physics calculations from vehicle packs. GPU bottlenecks typically stem from high-resolution texture packs, ENB/ReShade configurations, and increased draw distances.
FPS Optimization Techniques
Once you identify bottlenecks, apply targeted fixes: for CPU limits, reduce NPC density in popcycle.dat, lower traffic variety, and disable unnecessary background scripts. For GPU constraints, reduce ENB quality settings, lower shadow resolution, decrease reflection quality, and optimize texture streaming in visualsettings.dat. A well-optimized modded GTA 5 should maintain 45-60 FPS on mid-range hardware even with visual enhancement mods.
Profiling FiveM Servers
FiveM server performance requires different monitoring: use the built-in profiler with the /profiler command, monitor server tick rates through txAdmin, track resource CPU usage to identify problematic scripts, and watch network bandwidth for sync-heavy resources. Client-side, the F8 console shows resource load times and client FPS metrics essential for diagnosing server-related performance issues.


Comments0
Sign in to leave a comment
No comments yet. Be the first to comment!